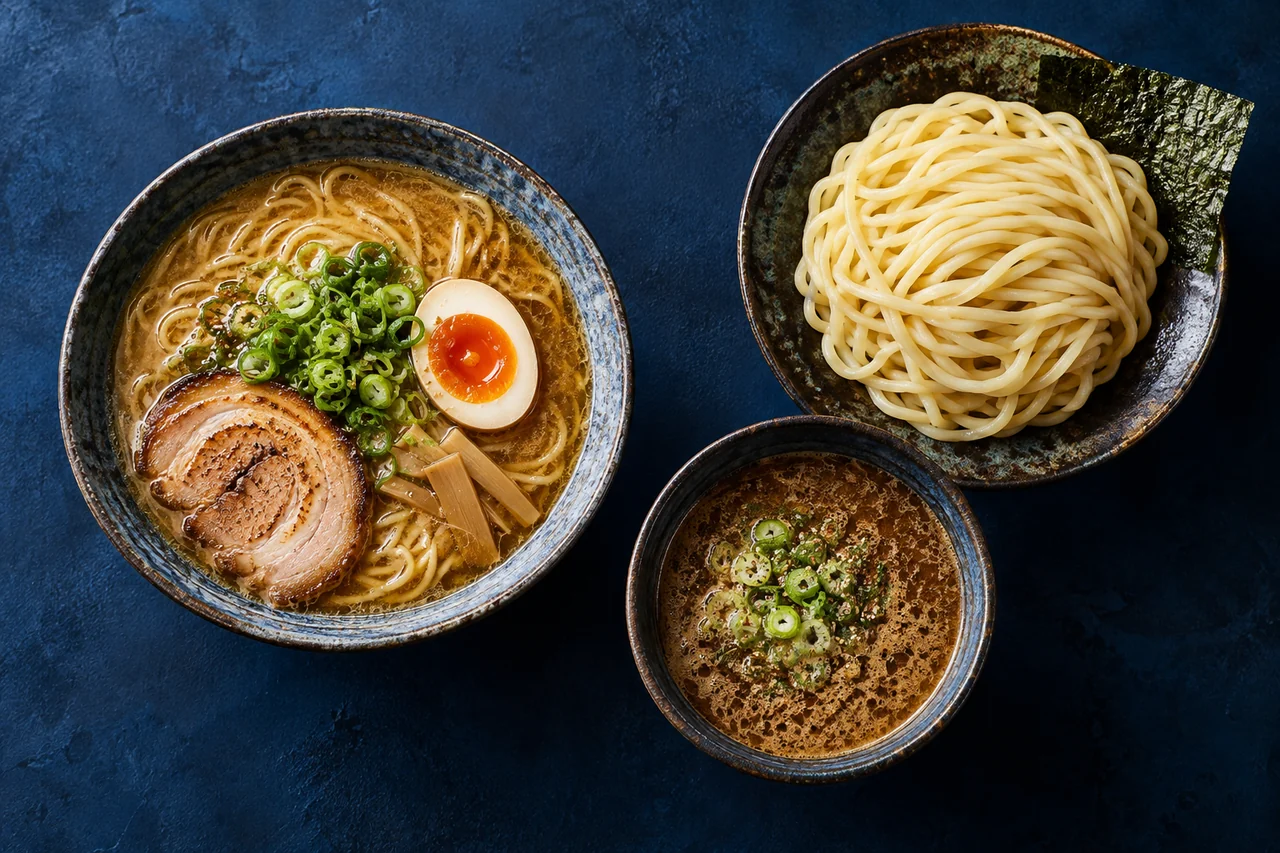
What was asked?
If you had to choose one, would you prefer ramen or tsukemen?
What this result tells us
In a December 2025 survey in Japan, 82.5% preferred ramen and 17.5% preferred tsukemen. The 1,100 respondents aged 20–69 had to choose one. These are not restaurant order volumes or sales rankings.
These are responses at the time of the survey, not a live measure or the views of every resident.
How the figures are counted
Respondents chose between two options. A neutral option was not offered.
63% versus 37% is a gap of 26 percentage points. It does not mean 26% better.
Questions and options are paraphrased and translated. Follow the source for the exact wording.
Vote and join the conversation
Visitor poll
This poll is open to visitors who choose to take part. Votes are counted separately from external surveys and do not represent the whole population.
If you had to choose one, would you prefer ramen or tsukemen?
Which side would you choose in this comparison?
Choose another option to change your vote.
Loading…
This article covers the period shown. The current situation may differ.
Sources and updates
- Period covered
- 2025-12-19 – 2025-12-21
When citing
Cross Marketing · 2025-12-19 – 2025-12-21 · Japan — If you had to choose one, would you prefer ramen or tsukemen? Ramen 82.5%, Tsukemen 17.5%. Response gap: 65 pp. 1,100 respondents in Japan aged 20–69
Comments
Respect different opinions. Abuse, personal attacks, private information and spam may be restricted. Comment guidelines · Privacy policy